GUI Debugger

Previous  Next


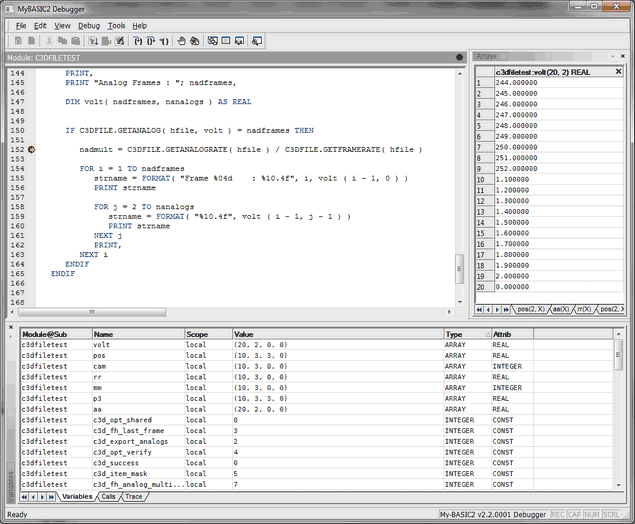
The MyBASIC2 GUI Debugger is a simple, yet full featured debugger allowing you to single step, single step into, set breakpoints, examine call stacks, use Traces, examine and modify variables and arrays.  Simple macro editor allows you to setup repeated commands for easier debugging.


clip0002


Source Window


Shows the source code with line numbers.  Breakpoints are shown with a round Red/brown circle and the current line is shown with a yellow arrow.


The source window header has a status indicator in right corner.  It shows the following status


idle   Debugger is in Idle Mode and the loaded program has not been started


run   The loaded program has been started and is Running


break   Program has been interrupted by a Break Point


step_over   Single Stepping Over


step_into   Single Stepping Into a function or another program


Variables


Shows the values of current variables and constants.  You can change the values of variables by double-clicking.  Editable variable values are high-lighted with Red when hovering over them.  You can hide selected items by right-clicking on an item and select HIDE "item".  To show all items, right-click and select Refresh.


Calls


Shows the current call and run stack

Trace


Output from TRACE statements

Arrays


Shows the current contents of selected array watches.  To select an array watch, double click on the array in the variable window or right-click and select "Add Array".  You can then select what dimension to watch.  Arrays can be modified.  A modifiable array value will be high-lighted in red when hovering over the value.