Step 3 - Transforming to 3D

|
Step 3 - Transforming to 3D |
|
|
Once you have digitized/tracked all the camera view, click on
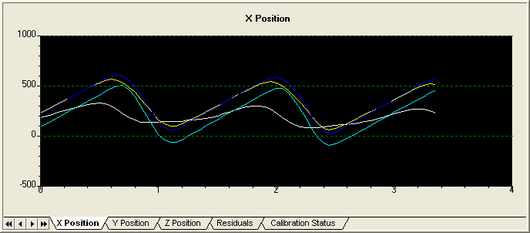
After the 3D transformation is completed, 3D trajectories and 3D residuals can be viewed in the output window. You can view X/Y/Z coordinates or residuals plotted over time by clicking the appropriate tab located at the bottom of the Graph.
The Legend table will also be filled in with the names from the camera view with the most points. This is normally the first camera window.
Figure 1, The legend
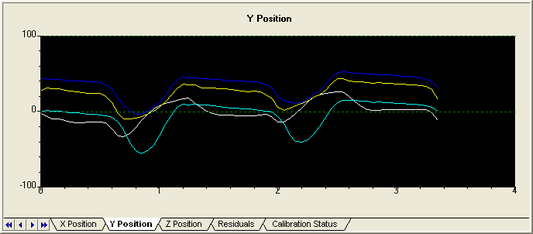
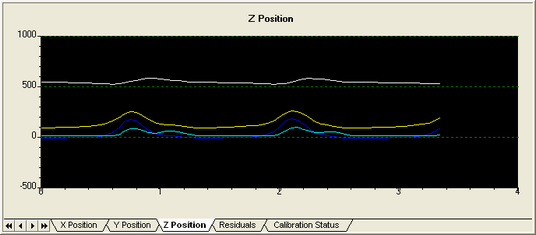
Examples of output graphs
Figure 2, X Position versus Time
Figure 3, Y Position versus Time
Figure 4, Z Position versus Time
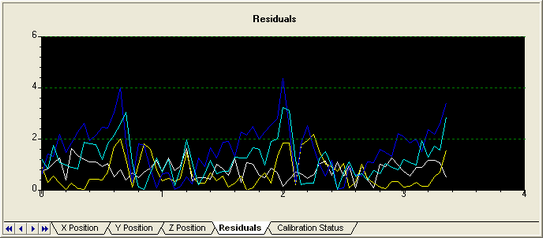
You can check the validity of transformed data from the residual graph.
Figure 5, Residual versus Time
If the obtained trajectory is not continuous, please check the following:
Once the transformation is performed, 3D data can be either saved as MaxTRAQ C3D file (c3d) or as an ASCII file (mqa) for further analysis.
|