Position Time Analysis


|
Position Time Analysis |
|
|
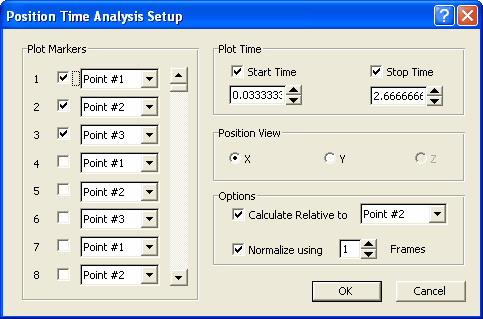
The Position Time Analysis allows you to create graphs based on movement over time of up to 50 markers at a time. You can graph any of these markers relative to another marker. Additionally, you can graph the data relative to the starting position by selecting the Normalize option. This option will calculate an average of the first n frames and then subtract this position from each consecutive frame creating a change of position graph.
Click on any item in the picture below for more information.
|